Gas prices have bottomed out and Atradius expects them to increase over the period up to 2021. Demand will be more moderate, but fueled primarily by China.
Summary
- After a period of sharp decline, gas prices seem to have reached a turning point and are expected to increase over the period up to 2021.
- Gas is becoming increasingly tradable. The US and Australia are building large export capacities for LNG gas. This is likely to keep regional price spreads far below their 2011-2014 levels.
- Global gas demand is expected to rise up to 2021, but at a more moderate pace than over past decades. China is expected to return as a key enging of demand growth.
In this Research Note we present our Gas Market Outlook 2017. This is an update of our 2015 Gas Market Outlook. Unlike the market for oil, the gas market has a strong regional component. We mainly focus on the three markets of North America, Asia and Europe, which each have their own pricing mechanisms and market conditions, but are also growing increasingly interlinked. In our previous Outlook, we concluded that the gas market is undergoing significant transformation. In this Outlook we will see that many of the forces described in the previous outlook – oil price decline, regional gas price convergence, increasing trade in gas – have largely continued.
We also provide an updated gas price forecast. We use the New Policies scenario from the International Energy Agency (IEA) as a baseline for this Outlook. The New Policies scenario takes into account the policies and measures that are already in place, but it also takes into account the aims, targets and intentions that have been announced, even if these have yet to be enshrined in legislation. The climate pledges, including the targets on carbon dioxide reduction, that are the building blocks of the Paris Agreement are taken into account in this scenario.
Gas price declined further
Gas markets are traditionally separated into three markets – North America, Asia and Europe – with each having their own characteristics. In North America, gas prices are determined at hubs as a result of supply and demand dynamics, while in Asia long-term contracts dominate the gas market that are often linked to the oil price. Gas trade in continental Europe also used to focus primarily on long-term oil-indexed contracts in the past, but is increasingly gravitating towards arrangements which allow prices to be set by gas-to-gas competition, which accounts for around half of European gas trade today.
After having declined significantly in 2014 and 2015, the gas price seems to have reached a turning point in all three regional markets, with a slight increase over the last couple of months (Figure 1). The oil price recovery and a revival of demand in the US account for this development. However, the gas price in Europe and Japan was still lower in December 2016 than in the same month last year.
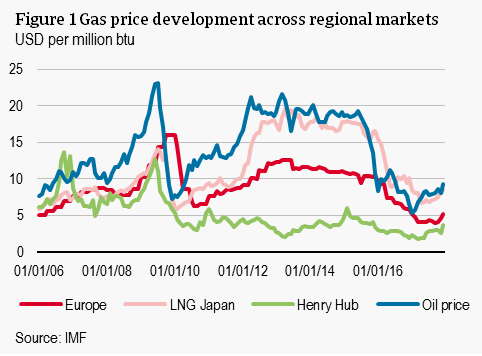
Looking at the bigger picture, gas prices are still much below their 2011-2014 level due to abundant supply of liquefied natural gas (LNG), slowing demand growth, low oil prices and ample availability of shale gas in North America. For the moment, there are few signs that the drop in prices in Europe and Asia is triggering much additional demand. In North America, the situation is quite different, with a new round of coal to gas switching in the US power sector. Increasing domestic consumption and higher exports caused the Henry Hub gas price to rise in recent months.
A major trend flagged in our 2015 Gas Market Outlook is the convergence between regional gas prices. This trend has continued in 2016. Over 2016 as a whole, the average difference between the Japanese LNG gas price and US gas was only USD 5.1 per million British thermal units (MMBtu), compared to an average spread of USD 13.3/mmbtu over the period 2011-2014. The decline in regional price spreads is driven by many of the trends described before: abundant supply of (tradeable) LNG, low oil prices and cooling demand from Asia. This caused regional price spreads to decline to levels that are more consistent with the costs of moving gas between markets.
US: building export capacity for gas
North America is a very dynamic region for global gas production. Gas can be produced at relatively low cost. Production growth has accelerated since the mid-2000s, when the shale revolution started. The US is the largest producer of gas, with an output of 768 billion cubic metre in 2015. Almost half of US gas production is in the form of shale gas. Given that around 10% of the estimated recoverable shale gas has thus far been produced, shale gas will continue to dominate US production and worldwide production of unconventional gas.
US shale gas has so far proven resilient to the current low price environment, due to the fall in drilling and service costs, as well as efficiency improvements. However, the first signs that low gas prices are having a negative effect on drilling activity and the completion of new wells in the US are appearing. Moreover, the availability of relatively cheap US gas is dampening the incentives for production in Canada and Mexico.
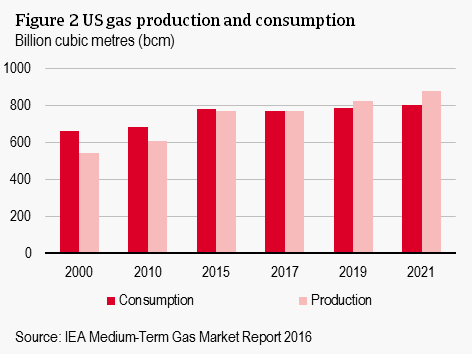
US gas production is expected to grow at an annual rate of 2.2% between 2015 and 2021. After dipping in 2016, it is expected to pick up strongly in the remaining period up to 2021. Growing supply will turn the US from a net importer to a net exporter of gas in the coming years. It is rapidly ramping up its export capacity for LNG and low gas prices of the last couple of years have spurred pipeline development to Mexico.
On the demand side, prices well below USD 3/mmbtu have prompted a new round of switching from coal to gas in the power sector. Last year, as much power was generated in the US from gas as from coal for the first time ever. However, up to 2021 consumption growth is expected to decline to a yearly average of 0.5%. This results from stagnation in gas-fired power generation due to sluggish growth in electricity demand, continued deployment of renewable energy and cheap coal. Growing demand for renewables is underpinned by an extension of federal incentives for solar and wind in 2015. Given the already low gas price, the coal-to-gas switching potential in electricity generation is expected to be limited.
Europe: diversifying gas supply
The European gas market is characterized by a strong link between the gas price and the oil price. Despite the rather substantial decline in the gas price last year, the outlook for production and consumption growth in the region is muted due to low economic growth, competition from coal in the power sector and efficiency measures in the residential and commercial sectors. Russia is Europe’s largest producer of gas. It acts as a ‘shock absorber’ to the global gas system, in the sense that the excess of LNG that does not go to Asia ends up in Europe, with Russia plugging the shortage of supply.
Given the decline of consumption in its domestic market and in western Europe, Russia has been scaling down production over the last couple of years. With the lower domestic consumption the country is determined to build demand in other markets by building pipelines into China. In addition, LNG provides an opportunity to sell gas globally. The two major gas producing countries in western Europe – Norway and the Netherlands - have experienced opposite developments. Gas production in the Netherlands has been scaled back sharply in recent years due to seismic activity in the drilling area. In Norway, production was up by 8.6% in 2015.
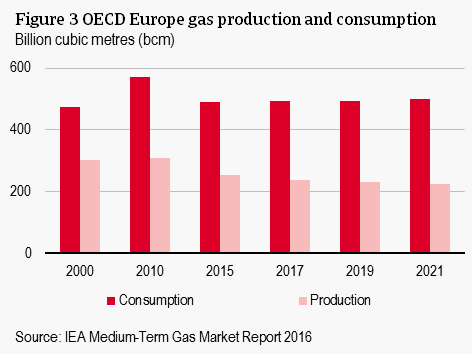
Production in Russia is expected to grow 0.5% per year between 2015 and 2021, with the increase tilted toward the end of the forecast period, when Yamal LNG and Power of Siberia pipeline will start ramping up production. Production in Norway is expected to decline up to 2021, given that low oil and gas prices have significantly reduced investments in exploration and production. In the Netherlands, production is expected to edge lower due to a production decline from the country’s small fields.
Gas consumption will increase moderately over the forecast period. The growing gap between supply and demand means that western Europe will have to import more gas, which can be achieved through pipeline imports from Russia or imports of LNG. Geopolitically, however, there is an incentive to reduce dependency on Russia by diversifying pipeline supply and increasing LNG imports. Importing LNG has also become more attractive due to the decline of LNG prices. Price setting power based on the oil price set by Russia is therefore expected to decline and increasingly supply and demand will determine the gas price in Europe.
Asia: return of strong demand growth
Demand for gas in Asia has grown more rapidly than supply over the past decades. Asia currently delivers 15% of world gas supply, while it accounts for 20% of global consumption. The gap is filled by imports of LNG gas. After decades of strong growth, demand for gas has cooled in recent years. In China, the largest gas consumer in Asia, gas demand grew by only 4% in 2015, the lowest in decades. Its economy is rebalancing away from a dominantly investment driven growth model and coal is still a serious competitor for gas in power generation. In India, gas demand is still lower than its 2010 peak, due to lower domestic production and relatively expensive imported LNG. Japan is the second-largest consumer of gas in the region, but unlike China completely depends on imports of LNG gas. Demand for gas in Japan declined in recent years, as high prices of LNG drove the country back to nuclear power generation.
Gas demand in Asia is expected to grow at an annual rate of 3.9% between 2015 and 2021. Gas consumption in China is even expected to increase by 9.1% per year over the same period. Relatively high economic growth, the need for residential heating and ongoing efforts to diversify away from coal underpin the demand for gas there. In India, demand is projected to grow at an average rate of 5.6% to 2021. Demand is bolstered by low LNG prices and government support for gas use in the power sector. Japan, on the other hand, is expected to experience further decline in consumption, due to returning nuclear power capacity, support for renewable energy and measures to support energy efficiency.
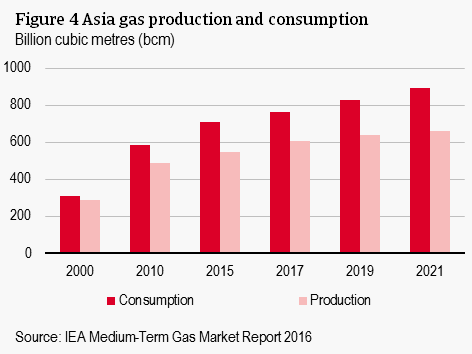
Asia has been rapidly stepping up the production of gas, with regional output nearly doubling between 2000 and 2015. China is the largest producer in the region, followed by Indonesia, Malaysia and Australia. Production growth in China is expected to increase at a yearly average of 5% between 2015 and 2021. Unconventional gas, which is currently 25% of total gas production in China, is set to increase to keep imports within a moderate range. Estimates indicate that China harbours vast reserves of unconventional gas, mostly in the form of shale gas, but the current low price environment is a challenging environment for the shale industry. In Australia gas production is expected to grow strongly in the period up to 2021, which is driven almost exclusively by the start-up of a large wave of LNG projects.
Most vulnerable countries
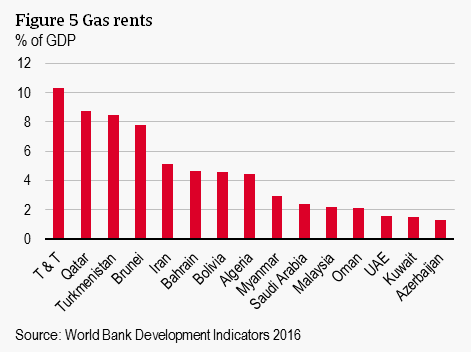
The current low gas price poses a challenge to gas exporting countries, as they are facing lower revenues than in previous years. Figure 5 plots a selection of countries that have high gas rents compared to the size of their economy. Trinidad & Tobago, Qatar, Turkmenistan and Brunei extract the highest gas rents relative to the size of their economy (over 6% of GDP). Many of the countries displayed in the figure are also oil exporters and have suffered from a combined effect of a lower oil and a lower gas price.
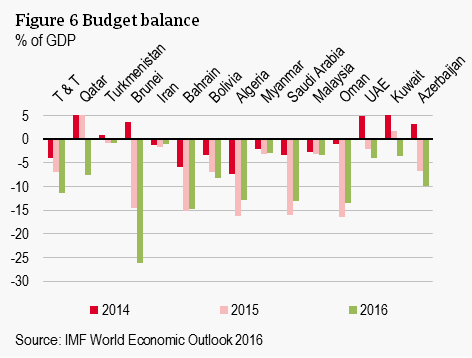
Countries that extract large gas rents generally saw their government finances deteriorating as a result of lower gas revenues. Figure 6 shows the development of budget balances over the period 2014-2016 for the same countries that are displayed above. The majority of these countries experienced a deterioration of their budget balance. Many of them have already taken measures to reduce their budget deficits. For instance, subsidies have been reduced, capital spending has been lowered and taxes increased.
From a country risk perspective, what mitigates the risk from higher budget deficits is that most countries have substantial foreign exchange reserves and/or sovereign wealth funds to absorb the negative impact from lower oil and gas prices. Many Middle Eastern and Central Asian countries have substantial sovereign wealth funds they use to finance budget deficits. Other countries have substantial foreign reserves, which gives them a good external liquidity position. None of the countries listed in Figure 5 are considered high risk.
Global gas price projections
Many of the trends we flagged in our previous outlook have continued: LNG is in abundant supply, demand remains subdued, the oil price has declined further and there is ample availability of shale gas in North America.
With a number of large export projects coming on stream in the US and Australia up to 2020, the supply of LNG continues to increase. This is keeping the gas price low and regional price spreads compressed. On the demand side, global gas consumption is expected to rise in almost every region. China is likely to return as a key engine of demand growth.
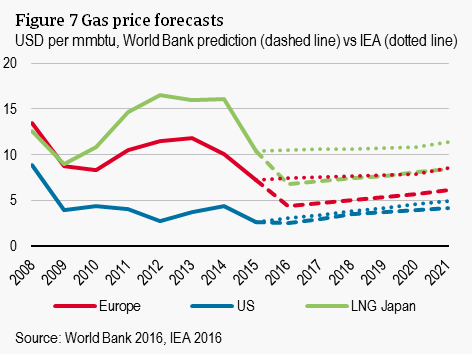
The gas price appears to have bottomed out in all three major markets – the US, Europe, and Japan – and is expected to increase further over the forecast horizon (Figure 7). This is the result of a gradual increase in the oil price, to which gas contracts are often indexed, and growing demand for gas, which will gradually absorb the current oversupply. The expectation is that regional price convergence will continue up to 2018. After 2018, the gas price in the US will increase more slowly than in Europe and Japan. However, gas prices will develop much more in line across markets than they have over previous years. The difference in gas prices between US and Japan amounted to USD 11.6 in 2014. In 2018, the price spread is projected to be USD 3.9, after which increases again to USD 5 in 2025.
Conclusion
A combination of abundant supply of LNG, slowing demand growth, low oil prices and ample availability of shale gas is keeping gas prices much below the 2011-2014 level. However, gas prices seem to have bottomed out in the US, Europe and Japan and are expected to increase further over the years to come. As gas becomes increasingly tradable, regional price spreads remain compressed. Being a relatively clean and flexible fuel, gas is likely to gain a higher share in the global total energy mix. While demand growth over the forecast period up to 2021 is likely to be more muted than over past decades, there remains considerable scope for further growth in Asia. China is expected to return as a key engine of demand growth over the next years. On the production side, a highly relevant development is the expansion of LNG export capacity, in particular in the US and Australia.

